Virus Risk Perspective: Comparing 15 Viruses Side by Side

How does a measles exposure compare to a dengue infection, or a hantavirus case to seasonal flu? This tool lines up 15 viruses on the same funnel — exposure, severe outcome, hospitalization, and death — using figures reported directly by CDC, WHO, and NIH.

Last reviewed: July 2026 · By Andy Wilcox, independent researcher

How to Read This Comparison

Every virus below is measured against the same four-stage funnel: how many people are exposed or infected annually, what share progress to a severe outcome, what share require hospitalization, and what the case-fatality picture looks like. Where a public health agency has not published a figure — or only publishes it as a range — this tool says so explicitly rather than estimating a number no agency has confirmed. A "Data not available" label means exactly that: not zero, not average, simply unpublished.

Every figure links back to its CDC, WHO, or NIH source and carries a "data as of" date. Diseases with an active or rapidly changing situation — currently Ebola, measles, mpox, Powassan virus, West Nile virus, dengue, and avian influenza A(H5N1) — carry a visible "Evolving situation" flag, since their figures can shift within weeks.

Case counts, hospitalization figures, and mortality data on this page are sourced directly from CDC, WHO, and other primary public health agencies as cited inline. This is statistical and educational information, not medical advice or a risk assessment for any individual. Figures for ongoing outbreaks change frequently — check the "data as of" date and linked source for the latest numbers.

This comparison currently shows United States data only. Every record also carries a WHO region, a surveillance-confidence rating, and a per-100,000-population field so that a country/region comparison can be added later without reworking the underlying data — that geographic layer isn't populated yet, so the country-selector UI stays hidden until it is.

Interactive Comparison

Sort by any funnel stage, or hide viruses you don't want to compare. This widget is a progressive enhancement over the static table below — if JavaScript is unavailable, the full data is still readable there.

Sort by:
Show/hide viruses (15 of 15)
United States funnel data only. Country/region comparison will be added once internationally comparable (Tier 1) surveillance data is available.
VirusAnnual exposure / cases (US)Severe outcome rateHospitalization rateCase fatality rateAnnual deaths (US)Data as of
Avian influenza A(H5N1)Evolving situationHigh surveillance confidence70Data not availableData not available1.43%1
COVID-19 (SARS-CoV-2)Moderate surveillance confidence10400000-16700000Data not availableData not availableData not available34000-53000
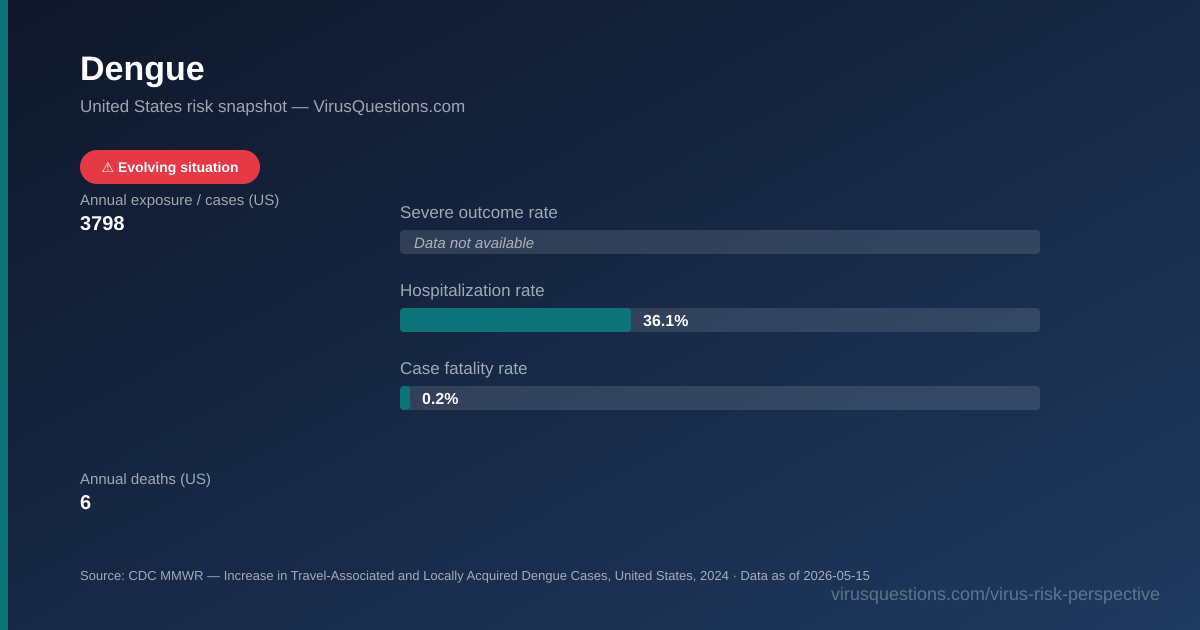
DengueEvolving situationHigh surveillance confidence3,798Data not available36.1%0.2%6
Ebola virus diseaseEvolving situationModerate surveillance confidence1000+Data not availableData not available25-50%Data not available
Hantavirus (hantavirus pulmonary syndrome, US)Evolving situationHigh surveillance confidenceData not availableData not availableData not available38%Data not available
Marburg virus diseaseModerate surveillance confidence14Data not availableData not available24-88%9
MeaslesEvolving situationHigh surveillance confidence2,288Data not available11%0.13%3
Mpox (monkeypox)Evolving situationModerate surveillance confidenceData not availableData not availableData not availableData not availableData not available
NorovirusModerate surveillance confidence19000000-21000000Data not availableData not availableData not available570-800
Powassan virusEvolving situationHigh surveillance confidenceData not availableData not available91.7%11%Data not available
Rabies (US)High surveillance confidence1,400,000Data not availableData not availableData not availableData not available
Respiratory syncytial virus (RSV)High surveillance confidence3600000-6500000Data not availableData not availableData not available10000-23000
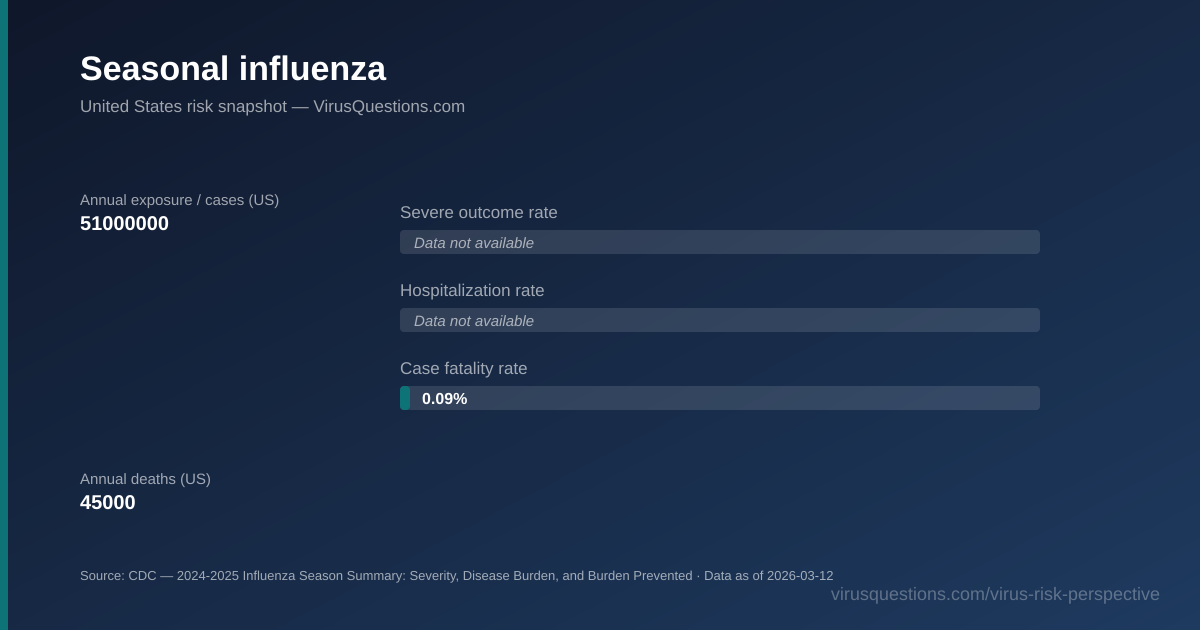
Seasonal influenzaHigh surveillance confidence51,000,000Data not availableData not available0.09%45,000
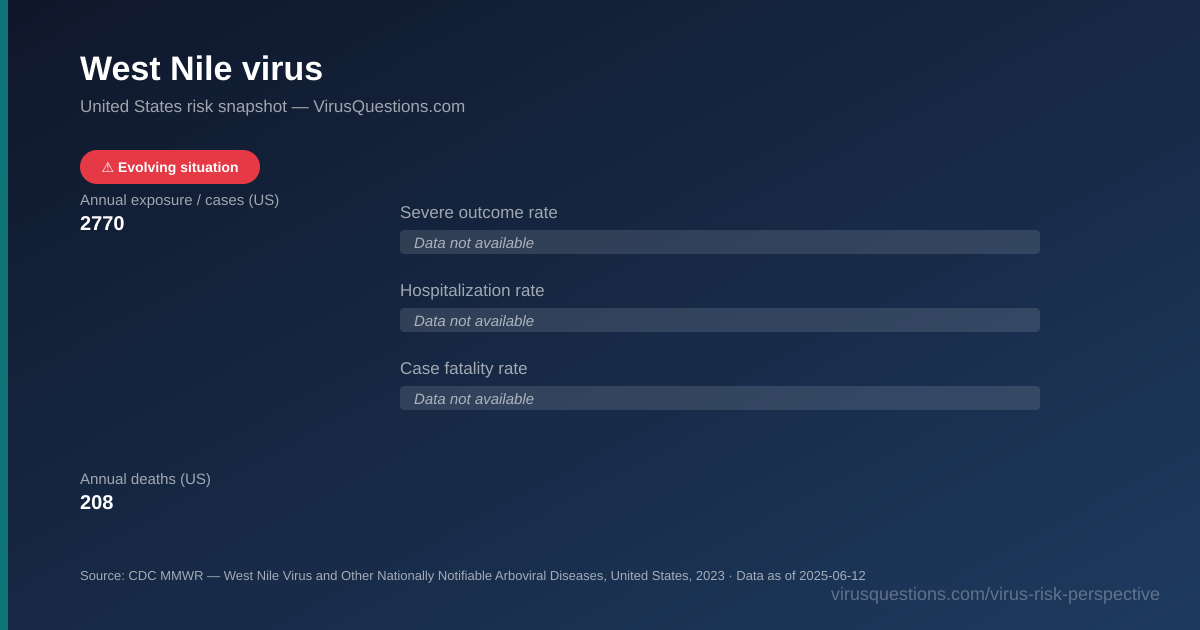
West Nile virusEvolving situationHigh surveillance confidence2,770Data not availableData not availableData not available208
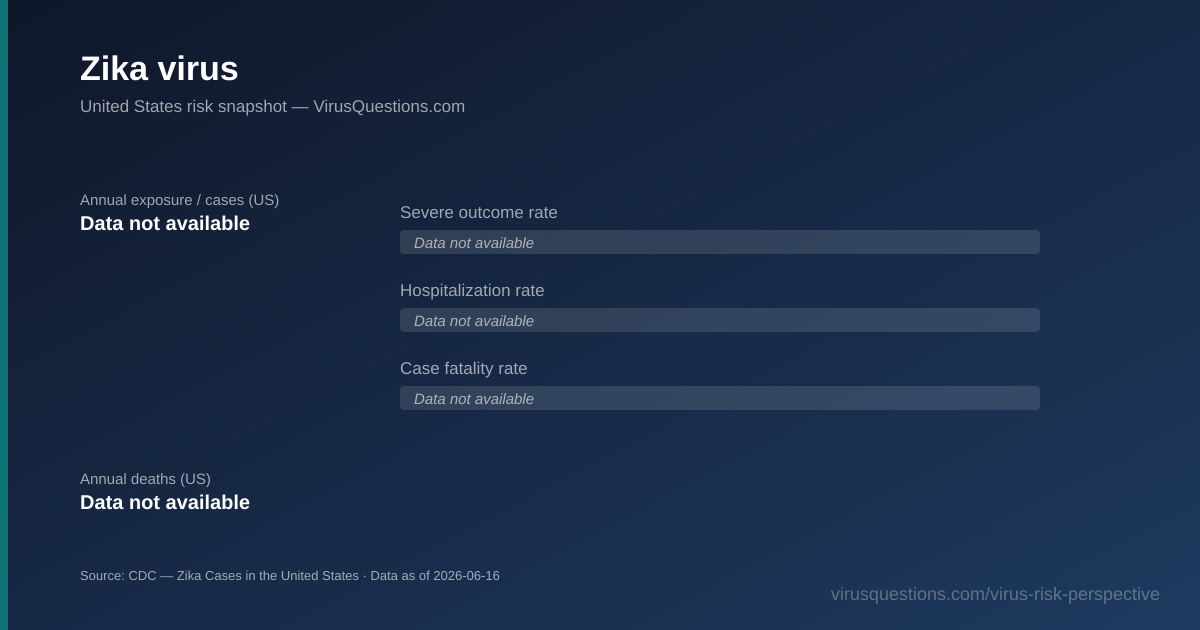
Zika virusHigh surveillance confidenceData not availableData not availableData not availableData not availableData not available

Full Comparison Table

United States funnel data for all 15 viruses covered by this tool.
Virus Annual exposure / cases (US) Severe outcome rate Hospitalization rate Case fatality rate Annual deaths (US) Data as of
COVID-19 (SARS-CoV-2) 10400000-16700000 Data not available Data not available Data not available 34000-53000 2026-02-19
Ebola virus disease ⚠ Evolving 1000+ Data not available Data not available 25-50% Data not available 2026-06-22
Hantavirus (hantavirus pulmonary syndrome, US) ⚠ Evolving Data not available Data not available Data not available 38% Data not available 2026-05-08
Norovirus 19000000-21000000 Data not available Data not available Data not available 570-800 2013-08-08
Measles ⚠ Evolving 2288 Data not available 11% 0.13% 3 2026-06-25
Mpox (monkeypox) ⚠ Evolving Data not available Data not available Data not available Data not available Data not available 2026-06-01
Powassan virus ⚠ Evolving Data not available Data not available 91.7% 11% Data not available 2026-06-02
Respiratory syncytial virus (RSV) 3600000-6500000 Data not available Data not available Data not available 10000-23000 2026-02-19
Seasonal influenza 51000000 Data not available Data not available 0.09% 45000 2026-03-12
Zika virus Data not available Data not available Data not available Data not available Data not available 2026-06-16
West Nile virus ⚠ Evolving 2770 Data not available Data not available Data not available 208 2025-06-12
Dengue ⚠ Evolving 3798 Data not available 36.1% 0.2% 6 2026-05-15
Rabies (US) 1400000 Data not available Data not available Data not available Data not available 2026-02-10
Avian influenza A(H5N1) ⚠ Evolving 70 Data not available Data not available 1.43% 1 2025-03-19
Marburg virus disease 14 Data not available Data not available 24-88% 9 2026-01-29

Virus-by-Virus Detail

COVID-19 (SARS-CoV-2)
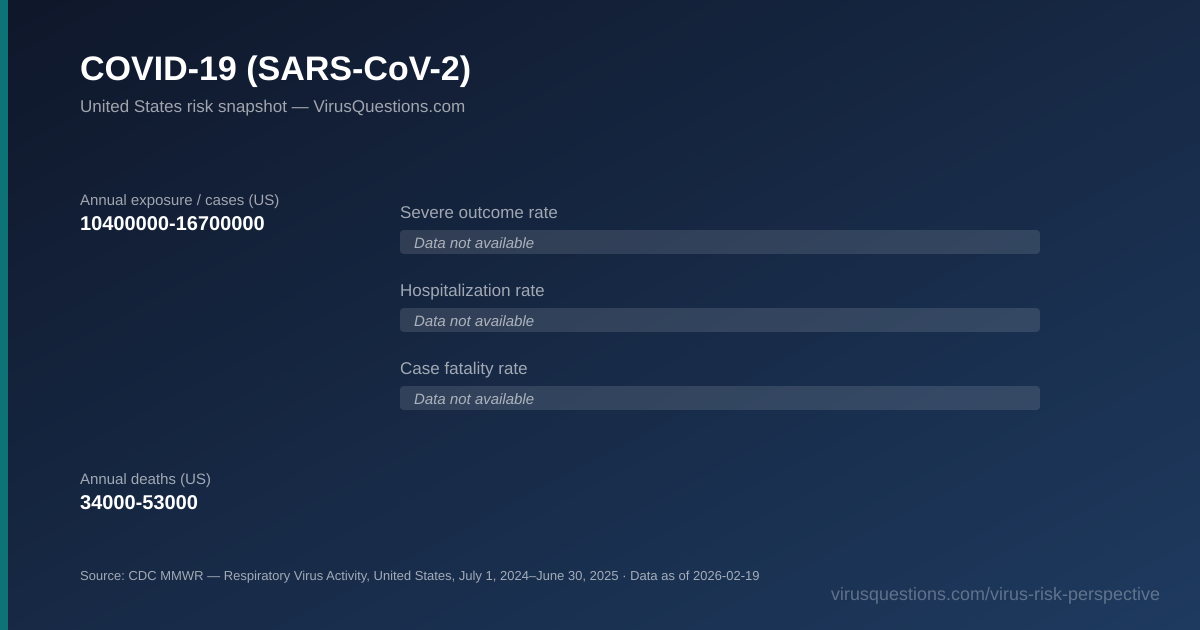
COVID-19 (SARS-CoV-2) risk snapshot chart — severe outcome, hospitalization, and case fatality rates
  • Annual exposure / cases (US): 10400000-16700000
  • Severe outcome rate: Data not available
  • Hospitalization rate: Data not available
  • Case fatality rate: Data not available
  • Annual deaths (US): 34000-53000

Source: CDC MMWR — Respiratory Virus Activity, United States, July 1, 2024–June 30, 2025 · Data as of 2026-02-19 · WHO region: AMRO · Surveillance confidence: moderate

Illness/hospitalization/death figures are Oct 1, 2024–Jul 5, 2025 modeled range estimates; COVID-19 is no longer nationally notifiable, so no clean confirmed-case count exists. cases_per_100k and case_fatality_rate_pct were considered for derivation in Phase B (SITE-PLAYBOOK.md §12a) but deliberately left UNAVAILABLE: both the case and death figures are ranges, not point estimates, and there's no stated pairing between a specific low/high case bound and its corresponding low/high death bound — deriving a rate would require inventing a pairing method CDC doesn't specify.
Read the full CoronavirusQuestions.com risk snapshot →

Ebola virus disease

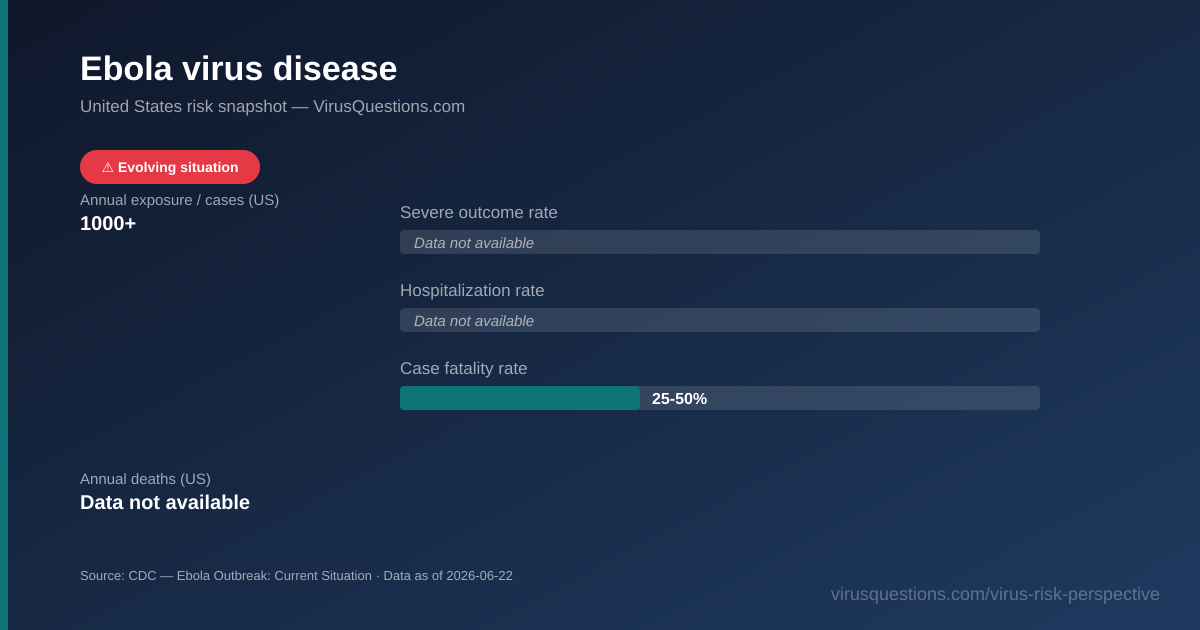
Evolving situation: Active WHO-declared PHEIC outbreak (Bundibugyo virus) in DRC/Uganda, over 1,000 confirmed cases as of June 22, 2026; zero cases reported in the US, CDC risk to US public assessed as low.

Ebola virus disease risk snapshot chart — severe outcome, hospitalization, and case fatality rates
  • Annual exposure / cases (US): 1000+
  • Severe outcome rate: Data not available
  • Hospitalization rate: Data not available
  • Case fatality rate: 25-50%
  • Annual deaths (US): Data not available

Source: CDC — Ebola Outbreak: Current Situation · Data as of 2026-06-22 · WHO region: AFR · Surveillance confidence: moderate

case_fatality_rate_pct is the CDC-stated historical range for Bundibugyo species specifically (2 prior outbreaks: 25% and 50%), not a finalized rate for the current 2026 outbreak, which CDC has not yet published as a single figure.

Read the full EbolaQuestions.com risk snapshot →

Hantavirus (hantavirus pulmonary syndrome, US)

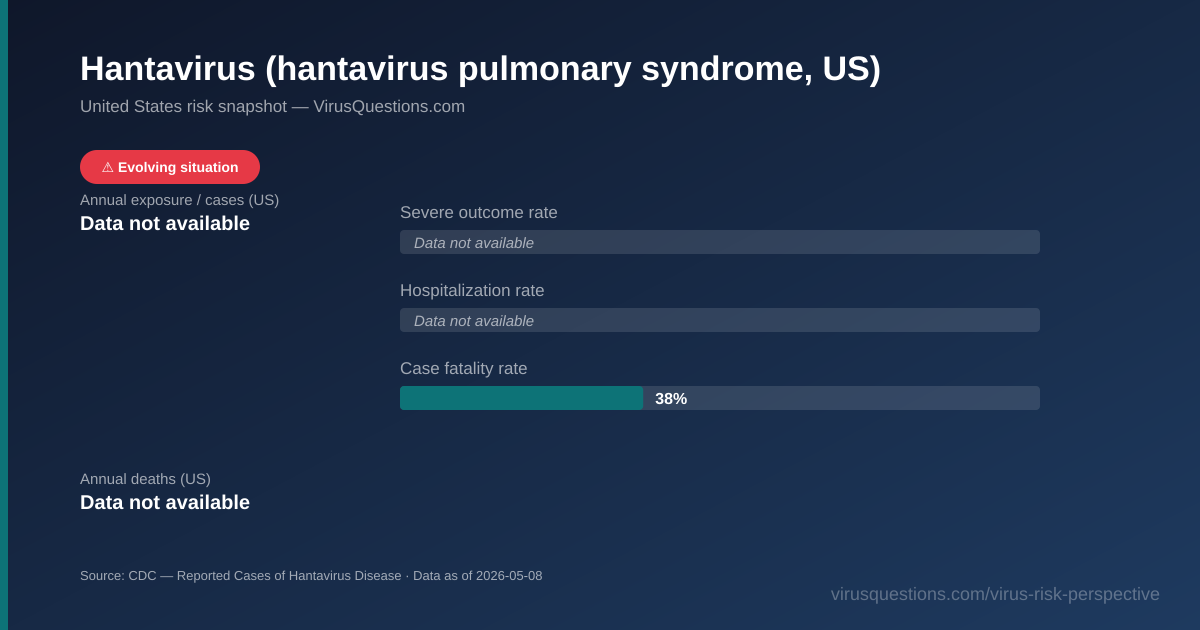
Evolving situation: A May 2026 Andes virus cluster linked to an international cruise ship is under active CDC investigation; no confirmed US cases from this cluster.

Hantavirus (hantavirus pulmonary syndrome, US) risk snapshot chart — severe outcome, hospitalization, and case fatality rates
  • Annual exposure / cases (US): Data not available
  • Severe outcome rate: Data not available
  • Hospitalization rate: Data not available
  • Case fatality rate: 38%
  • Annual deaths (US): Data not available

Source: CDC — Reported Cases of Hantavirus Disease · Data as of 2026-05-08 · WHO region: AMRO · Surveillance confidence: high

CDC's own page reports only a cumulative total (890 cases, 1993-2023), not a clean single-year annual figure, so annual_exposure_or_cases_estimate is UNAVAILABLE rather than substituting the cumulative number. case_fatality_rate_pct (38%) is specifically for hantavirus pulmonary syndrome once respiratory symptoms develop. severe_outcome_rate_pct/hospitalization_rate_pct left UNAVAILABLE after a Phase B literature search: HPS by clinical case definition already involves respiratory failure, so a distinct 'hospitalization rate' may not be a meaningful CDC/literature statistic; the only figure found (67% required mechanical ventilation) came from a 12-patient pediatric case series, too narrow to represent the general population.

Read the full HantavirusQuestions.com risk snapshot →

Norovirus

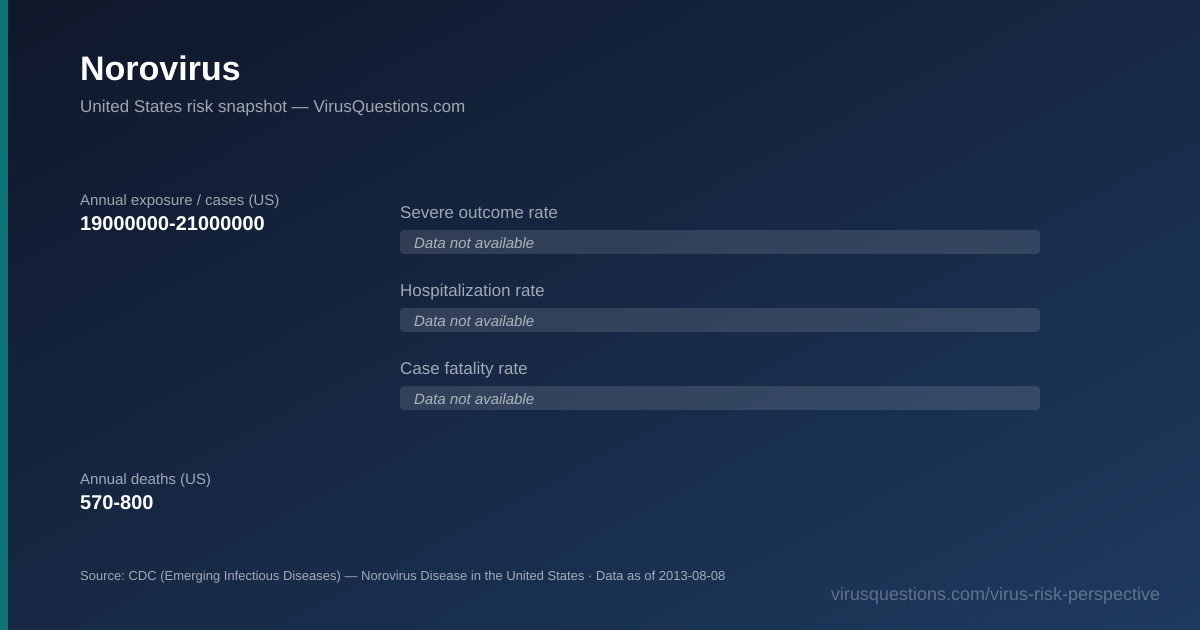
Norovirus risk snapshot chart — severe outcome, hospitalization, and case fatality rates
  • Annual exposure / cases (US): 19000000-21000000
  • Severe outcome rate: Data not available
  • Hospitalization rate: Data not available
  • Case fatality rate: Data not available
  • Annual deaths (US): 570-800

Source: CDC (Emerging Infectious Diseases) — Norovirus Disease in the United States · Data as of 2013-08-08 · WHO region: AMRO · Surveillance confidence: moderate

This is CDC's own synthesized multi-study burden estimate; it is the most recent CDC-published figure verifiable with a static, citable number, though the underlying publication date is 2013. Norovirus is not individually case-reportable, so no more recent CDC aggregate figure with a direct URL was found.

Read the full NorovirusQuestions.com risk snapshot →

Measles

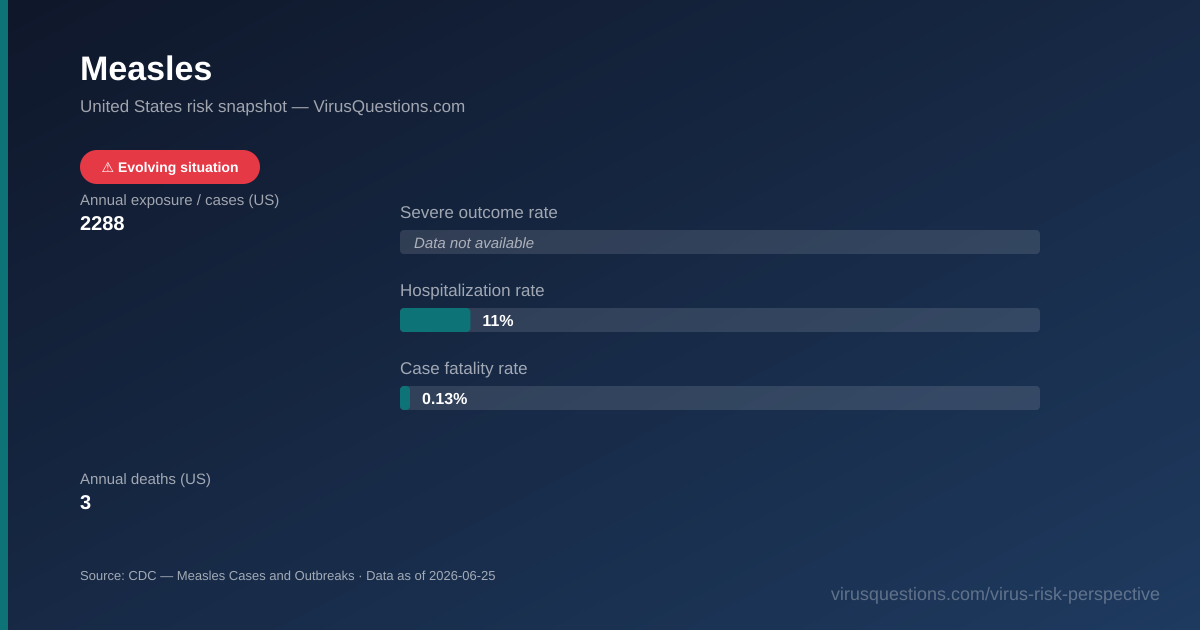
Evolving situation: Largest US measles resurgence since 1992 (2,288 confirmed cases, full-year 2025); 2026 already at 2,134 confirmed cases as of June 25, 2026.

Measles risk snapshot chart — severe outcome, hospitalization, and case fatality rates
  • Annual exposure / cases (US): 2288
  • Severe outcome rate: Data not available
  • Hospitalization rate: 11%
  • Case fatality rate: 0.13%
  • Annual deaths (US): 3

Source: CDC — Measles Cases and Outbreaks · Data as of 2026-06-25 · WHO region: AMRO · Surveillance confidence: high

annual_exposure_or_cases_estimate and annual_deaths_estimate are full-year 2025 confirmed totals. hospitalization_rate_pct (11%) is from the CDC MMWR Jan-Apr 2025 update, the most specific percentage CDC published. case_fatality_rate_pct is a same-record derivation (deaths ÷ cases, both CDC full-year 2025 US totals) per the tiered-sourcing/derivation policy (SITE-PLAYBOOK.md §12a) — previously left UNAVAILABLE when derivation from raw CDC figures wasn't yet permitted.

Mpox (monkeypox)

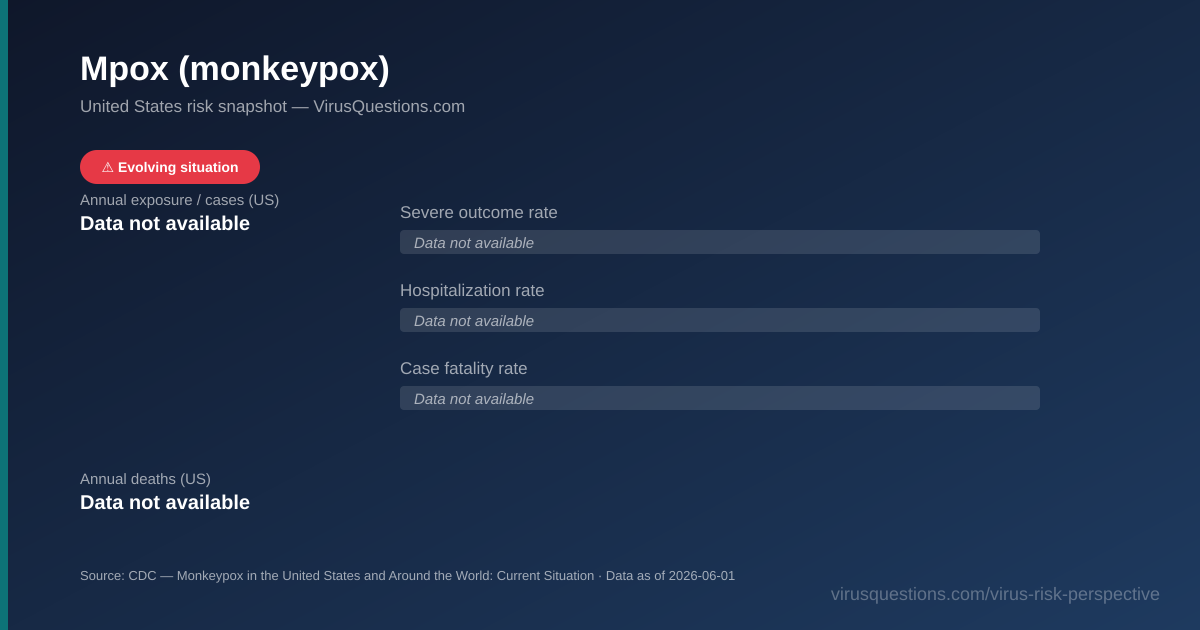
Evolving situation: Clade I mpox (more severe, DRC-origin strain) has produced a small but growing number of travel-associated US cases since late 2024; clade II continues circulating domestically at low levels, with fall 2025 the highest monthly case count since the 2022 peak.

Mpox (monkeypox) risk snapshot chart — severe outcome, hospitalization, and case fatality rates
  • Annual exposure / cases (US): Data not available
  • Severe outcome rate: Data not available
  • Hospitalization rate: Data not available
  • Case fatality rate: Data not available
  • Annual deaths (US): Data not available

Source: CDC — Monkeypox in the United States and Around the World: Current Situation · Data as of 2026-06-01 · WHO region: AMRO · Surveillance confidence: moderate

CDC's own case-data page is dashboard-rendered without a static aggregate total in page text, so all funnel fields are UNAVAILABLE rather than substituting figures from secondary press coverage. A Phase B literature search for a Tier 1.5/2 severe-outcome or hospitalization rate found only fragmented, subgroup-specific figures (e.g. a vaccinated-subgroup hospitalization count in one CDC surveillance update) — none representative enough of the general US case population to populate a funnel field responsibly.

Powassan virus

Evolving situation: Widely reported as a record year (2025) based on CDC surveillance data, but CDC's own dashboard is interactive/PowerBI-style and does not display a static year-end total in fetchable page text, so annual_exposure_or_cases_estimate is left UNAVAILABLE.

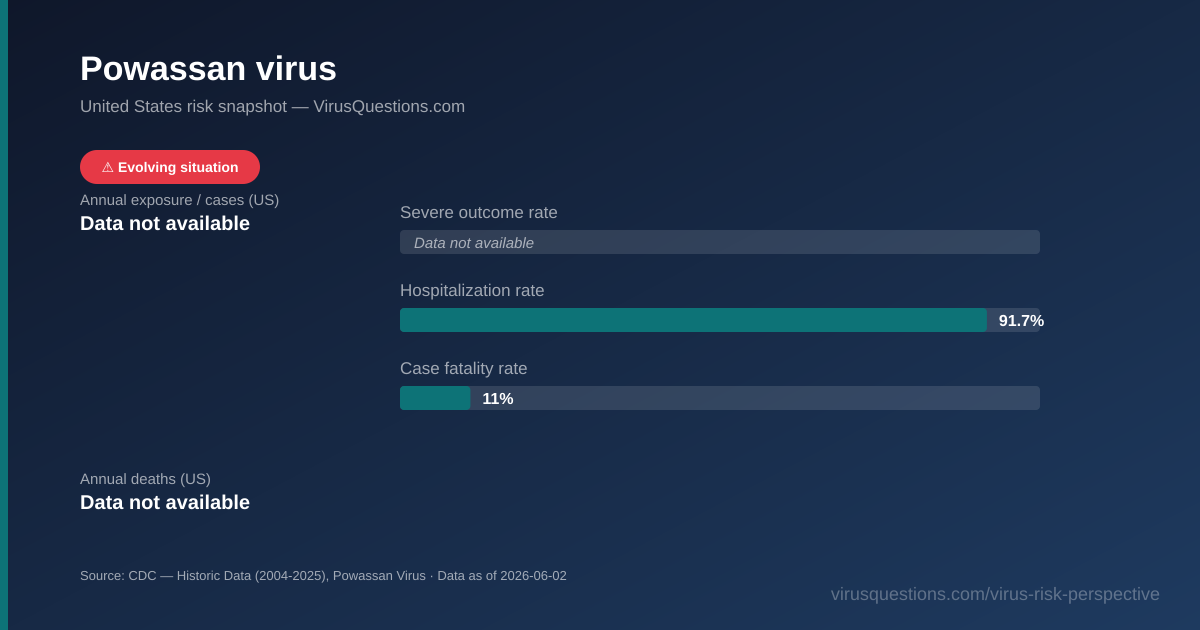
Powassan virus risk snapshot chart — severe outcome, hospitalization, and case fatality rates
  • Annual exposure / cases (US): Data not available
  • Severe outcome rate: Data not available
  • Hospitalization rate: 91.7%
  • Case fatality rate: 11%
  • Annual deaths (US): Data not available

Source: CDC — Historic Data (2004-2025), Powassan Virus · Data as of 2026-06-02 · WHO region: AMRO · Surveillance confidence: high

case_fatality_rate_pct (11%) is from a CDC-authored 2006-2016 cohort study (11 of 99 cases died), not a current-year figure — the most rigorous CDC-sourced CFR verifiable. hospitalization_rate_pct (91.7%) is a separate, Tier 2 figure (264 of 288 CDC-reported cases, 2004-2022, per a 2023 systematic review) — a different underlying case set/period than the CFR cohort above; not additive or directly comparable to it. severe_outcome_rate_pct left UNAVAILABLE: Powassan neuroinvasive disease is the only form nationally notifiable, so any 'severe outcome' percentage drawn from this surveillance stream would reflect ascertainment bias (mild/non-neuroinvasive infections are essentially never captured) rather than a true population rate.

Respiratory syncytial virus (RSV)

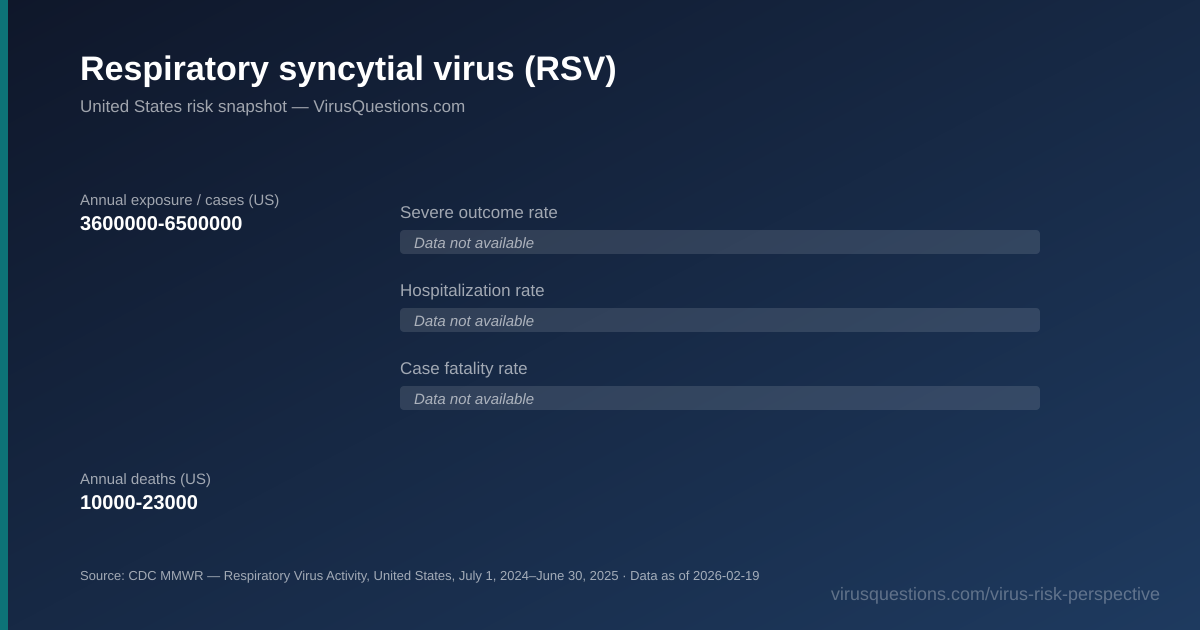
Respiratory syncytial virus (RSV) risk snapshot chart — severe outcome, hospitalization, and case fatality rates
  • Annual exposure / cases (US): 3600000-6500000
  • Severe outcome rate: Data not available
  • Hospitalization rate: Data not available
  • Case fatality rate: Data not available
  • Annual deaths (US): 10000-23000

Source: CDC MMWR — Respiratory Virus Activity, United States, July 1, 2024–June 30, 2025 · Data as of 2026-02-19 · WHO region: AMRO · Surveillance confidence: high

annual_exposure_or_cases_estimate is outpatient visits (Oct 1, 2024-May 3, 2025), the closest CDC equivalent to a case estimate since RSV isn't individually notifiable; hospitalizations were 190,000-350,000 in the same window. hospitalization_rate_pct was considered for derivation in Phase B (SITE-PLAYBOOK.md §12a) but deliberately left UNAVAILABLE: both the hospitalization count and the outpatient-visit denominator are ranges with no stated low/high pairing, so a derived rate would require inventing a pairing method CDC doesn't specify.
Seasonal influenza

Seasonal influenza risk snapshot chart — severe outcome, hospitalization, and case fatality rates
  • Annual exposure / cases (US): 51000000
  • Severe outcome rate: Data not available
  • Hospitalization rate: Data not available
  • Case fatality rate: 0.09%
  • Annual deaths (US): 45000

Source: CDC — 2024-2025 Influenza Season Summary: Severity, Disease Burden, and Burden Prevented · Data as of 2026-03-12 · WHO region: AMRO · Surveillance confidence: high

2024-25 was classified 'high severity' — the most severe season since 2017-18. CDC's own long-run range (2010-2025) is 9.4M-51M illnesses and 6,300-52,000 deaths, so this single season sits at the top of that range. case_fatality_rate_pct is a same-record derivation (deaths ÷ illnesses, both CDC 2024-25-season modeled estimates) per SITE-PLAYBOOK.md §12a; both inputs are model-based CDC burden estimates, not raw notified counts, since seasonal influenza isn't individually reportable.

Zika virus

Zika virus risk snapshot chart — severe outcome, hospitalization, and case fatality rates
  • Annual exposure / cases (US): Data not available
  • Severe outcome rate: Data not available
  • Hospitalization rate: Data not available
  • Case fatality rate: Data not available
  • Annual deaths (US): Data not available

Source: CDC — Zika Cases in the United States · Data as of 2026-06-16 · WHO region: AMRO · Surveillance confidence: high

CDC states no local mosquito-borne Zika transmission has been reported in the continental US since 2018, and no confirmed cases from US territories since 2019. The case-count table on this page could not be extracted as a clean static annual figure with certainty, so funnel fields are UNAVAILABLE rather than guessed.

West Nile virus

Evolving situation: 2023 figures (2,770 cases, 95% West Nile) are the most recent finalized full-year CDC data; the 2025 season was tracking at 771 cases (490 neuroinvasive) as of Sept 9, 2025 per preliminary ArboNET data, but that season total was not yet finalized as of this research.

West Nile virus risk snapshot chart — severe outcome, hospitalization, and case fatality rates
  • Annual exposure / cases (US): 2770
  • Severe outcome rate: Data not available
  • Hospitalization rate: Data not available
  • Case fatality rate: Data not available
  • Annual deaths (US): 208

Source: CDC MMWR — West Nile Virus and Other Nationally Notifiable Arboviral Diseases, United States, 2023 · Data as of 2025-06-12 · WHO region: AMRO · Surveillance confidence: high

annual_exposure_or_cases_estimate and annual_deaths_estimate cover all six nationally notifiable arboviral diseases combined (West Nile is 95% of cases), since CDC reports these jointly in this MMWR. cases_per_100k and case_fatality_rate_pct were considered for derivation in Phase B (SITE-PLAYBOOK.md §12a) but deliberately left UNAVAILABLE: both inputs cover the combined 6-disease total, not West Nile virus alone, so a derived figure would misrepresent this specific pathogen's rate rather than merely reflect an imprecise period.

Dengue

Evolving situation: 2024 US cases were 359% above the 2010-2023 annual average, driven almost entirely by travel-associated infections amid a record global surge; local transmission is also expanding in Florida.

Dengue risk snapshot chart — severe outcome, hospitalization, and case fatality rates
  • Annual exposure / cases (US): 3798
  • Severe outcome rate: Data not available
  • Hospitalization rate: 36.1%
  • Case fatality rate: 0.2%
  • Annual deaths (US): 6

Source: CDC MMWR — Increase in Travel-Associated and Locally Acquired Dengue Cases, United States, 2024 · Data as of 2026-05-15 · WHO region: AMRO · Surveillance confidence: high

97.2% of 2024 cases were travel-associated; 2.8% locally acquired (Florida, California, Texas). cases_per_100k is a Tier 1.5 derivation (CDC 2024 case count ÷ US Census Vintage 2024 population estimate) per SITE-PLAYBOOK.md §12a — previously left UNAVAILABLE when derivation from raw CDC figures wasn't yet permitted. severe_outcome_rate_pct left UNAVAILABLE: CDC's MMWR on 2010-2021 US travel-associated dengue reports severe dengue as a small proportion of cases ("<1%") but does not publish an exact percentage — forcing that qualitative language into a point estimate would overstate precision CDC itself doesn't claim.

Rabies (US)

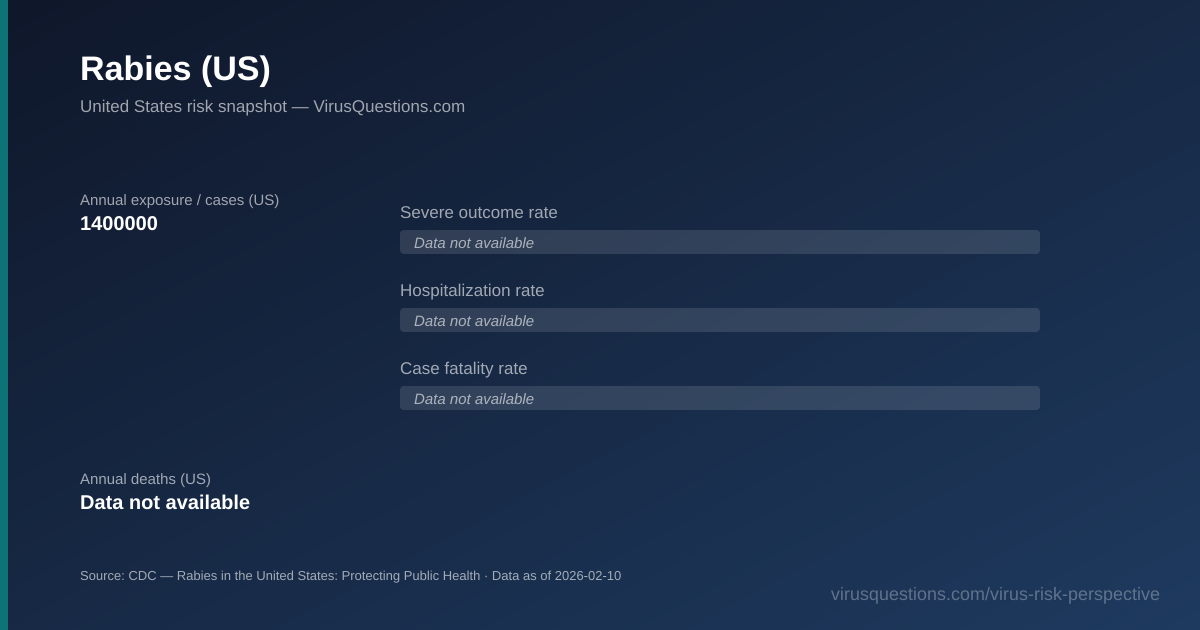
Rabies (US) risk snapshot chart — severe outcome, hospitalization, and case fatality rates
  • Annual exposure / cases (US): 1400000
  • Severe outcome rate: Data not available
  • Hospitalization rate: Data not available
  • Case fatality rate: Data not available
  • Annual deaths (US): Data not available

Source: CDC — Rabies in the United States: Protecting Public Health · Data as of 2026-02-10 · WHO region: AMRO · Surveillance confidence: high

annual_exposure_or_cases_estimate (1.4 million) is Americans who seek healthcare for a possible rabies exposure annually; of these, 100,000 receive post-exposure prophylaxis. CDC states deaths are 'fewer than 10' per year rather than a precise figure, and states the disease is 'nearly 100%' fatal without timely PEP once symptoms begin — both left as qualitative CDC language rather than forced into a point-estimate percentage.

Avian influenza A(H5N1)

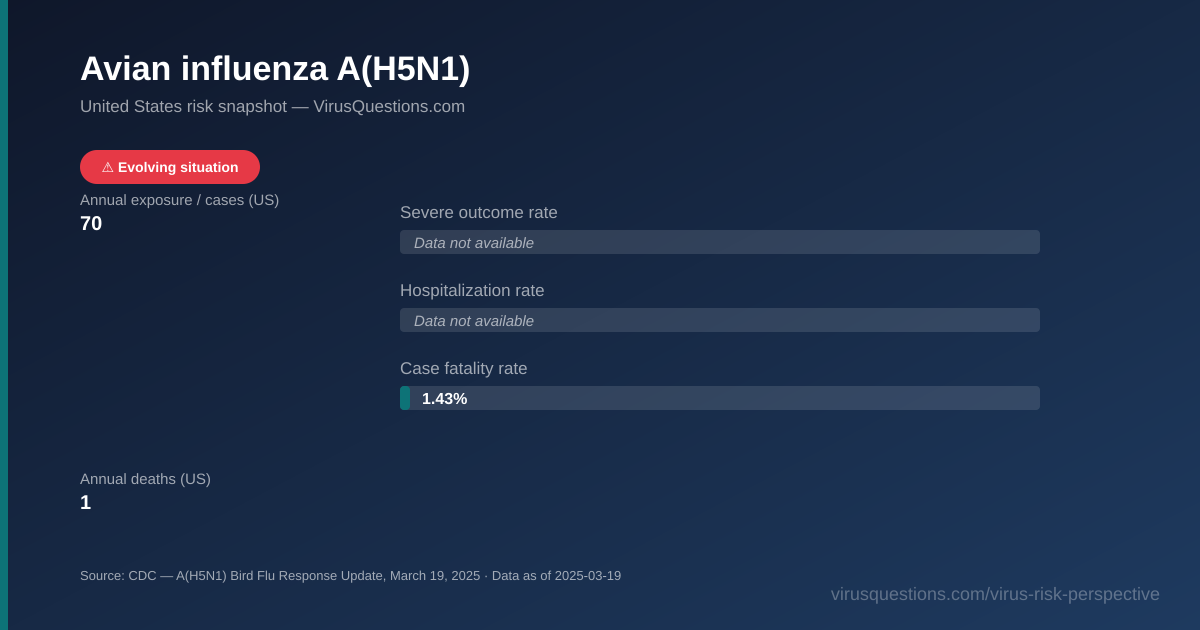
Evolving situation: Ongoing multistate outbreak in dairy cattle and poultry since spring 2024; global historical H5N1 mortality is around 50%, but US cases have been overwhelmingly mild by comparison. More recent CDC updates likely exist beyond this cited page.

Avian influenza A(H5N1) risk snapshot chart — severe outcome, hospitalization, and case fatality rates
  • Annual exposure / cases (US): 70
  • Severe outcome rate: Data not available
  • Hospitalization rate: Data not available
  • Case fatality rate: 1.43%
  • Annual deaths (US): 1

Source: CDC — A(H5N1) Bird Flu Response Update, March 19, 2025 · Data as of 2025-03-19 · WHO region: AMRO · Surveillance confidence: high

70 is a cumulative outbreak total (since April 2024) rather than a clean annual figure; 41 cases were dairy-cow exposure, 26 poultry exposure. No human-to-human transmission identified. cases_per_100k and case_fatality_rate_pct are derivations per SITE-PLAYBOOK.md §12a — both explicitly labeled as covering the outbreak-to-date window (not a calendar year) and, for CFR, the mild US outbreak specifically (not the far higher global historical H5N1 rate).

Marburg virus disease

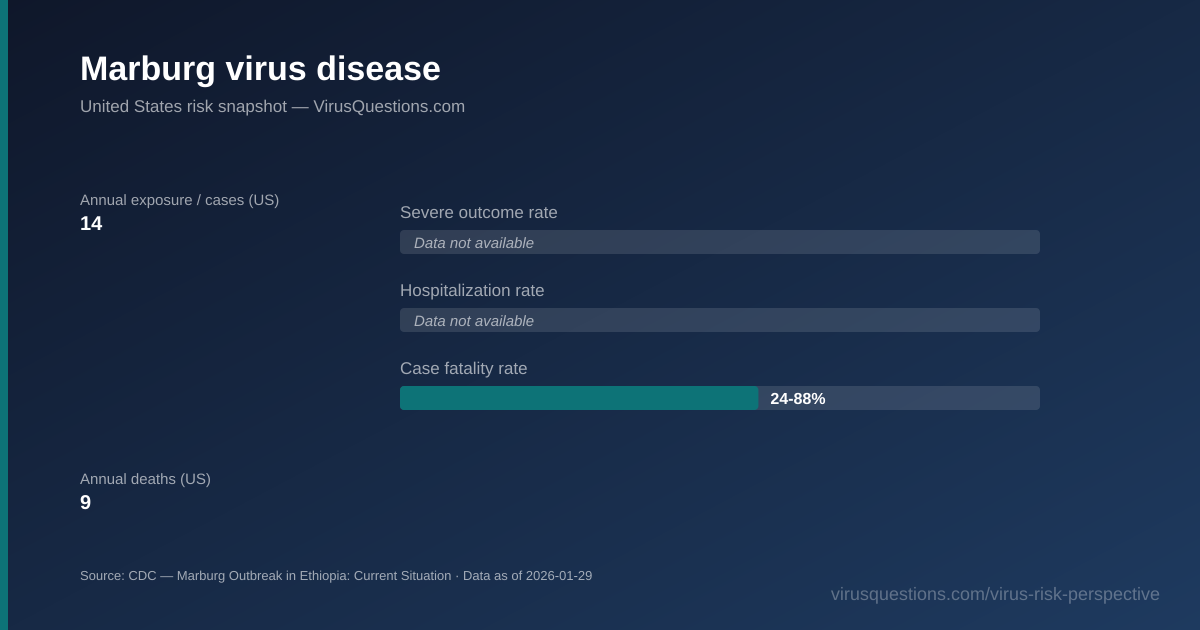
Marburg virus disease risk snapshot chart — severe outcome, hospitalization, and case fatality rates
  • Annual exposure / cases (US): 14
  • Severe outcome rate: Data not available
  • Hospitalization rate: Data not available
  • Case fatality rate: 24-88%
  • Annual deaths (US): 9

Source: CDC — Marburg Outbreak in Ethiopia: Current Situation · Data as of 2026-01-29 · WHO region: AFR · Surveillance confidence: moderate

annual_exposure_or_cases_estimate (14) and annual_deaths_estimate (9) are the final totals for Ethiopia's first-ever Marburg outbreak (Nov 2025-Jan 2026), which CDC/Ethiopia declared over on Jan 26, 2026. case_fatality_rate_pct is WHO's stated historical range across all outbreaks ('around 50% on average, 24-88% range'), not specific to this outbreak. No Marburg cases have ever been reported in the US; CDC assessed risk to the US public as low throughout this outbreak.

Sources & References